Run visibility
You can view the history of your runs and the model timing dashboard to help identify where improvements can be made to jobs.
Run history
The Run history dashboard in dbt Cloud helps you monitor the health of your dbt project. It provides a detailed overview of all your project's job runs and empowers you with a variety of filters that enable you to focus on specific aspects. You can also use it to review recent runs, find errored runs, and track the progress of runs in progress. You can access it from the top navigation menu by clicking Deploy and then Run history.
The dashboard displays your full run history, including job name, status, associated environment, job trigger, commit SHA, schema, and timing info.
dbt Cloud developers can access their run history for the last 365 days through the dbt Cloud user interface (UI) and API.
dbt Labs limits self-service retrieval of run history metadata to 365 days to improve dbt Cloud's performance.
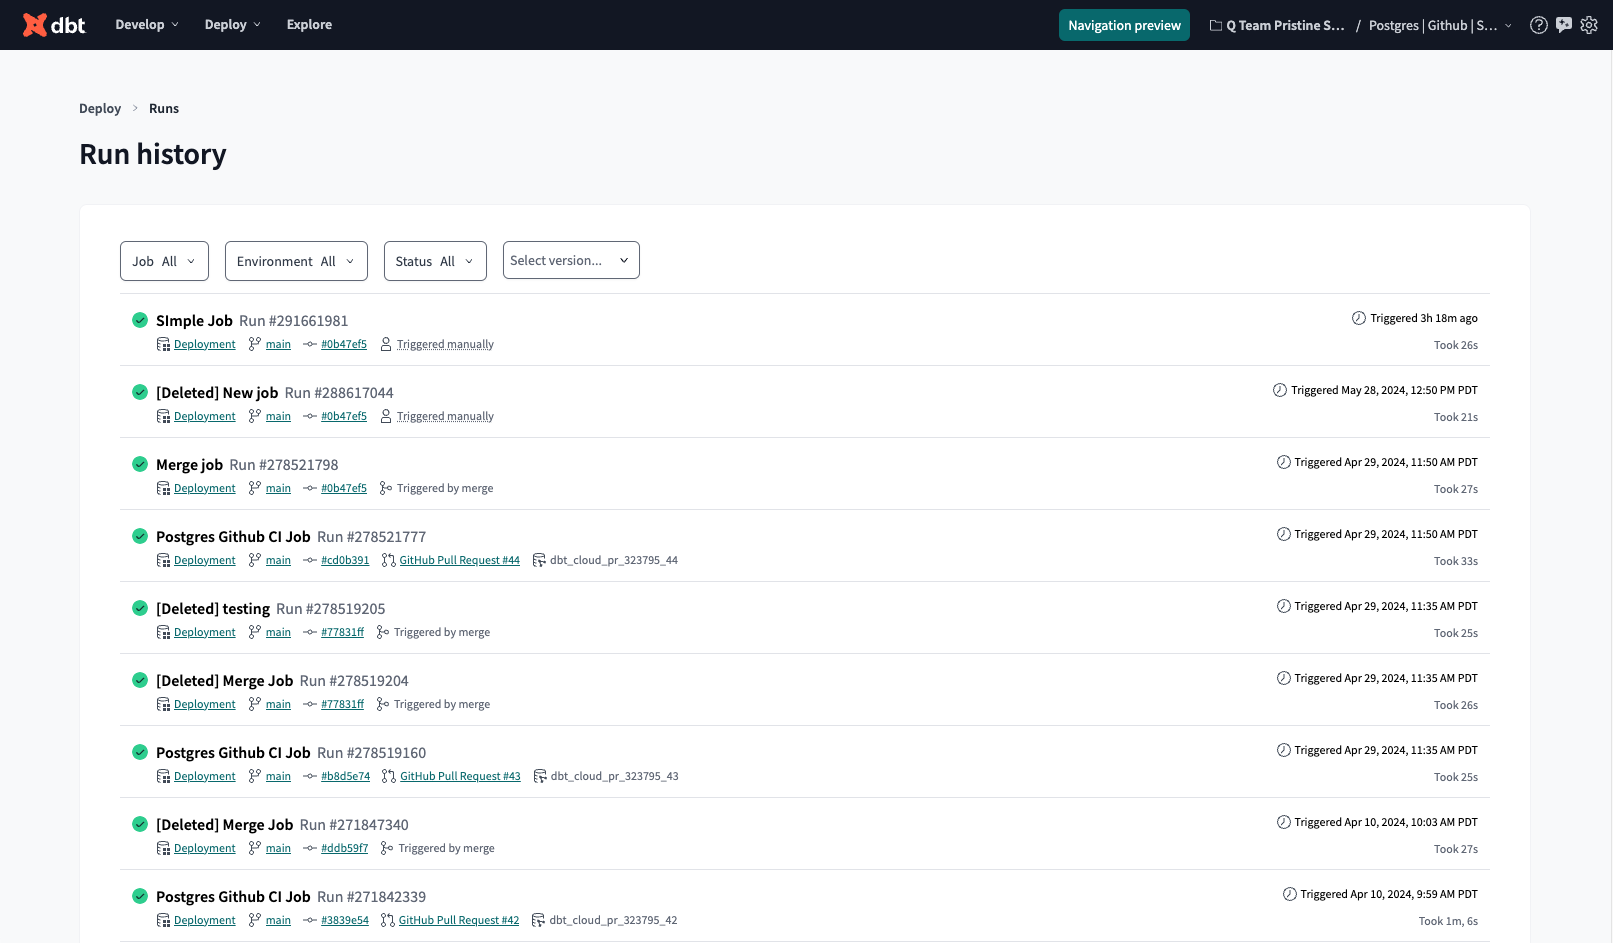 Run history dashboard allows you to monitor the health of your dbt project and displays jobs, job status, environment, timing, and more.
Job run details
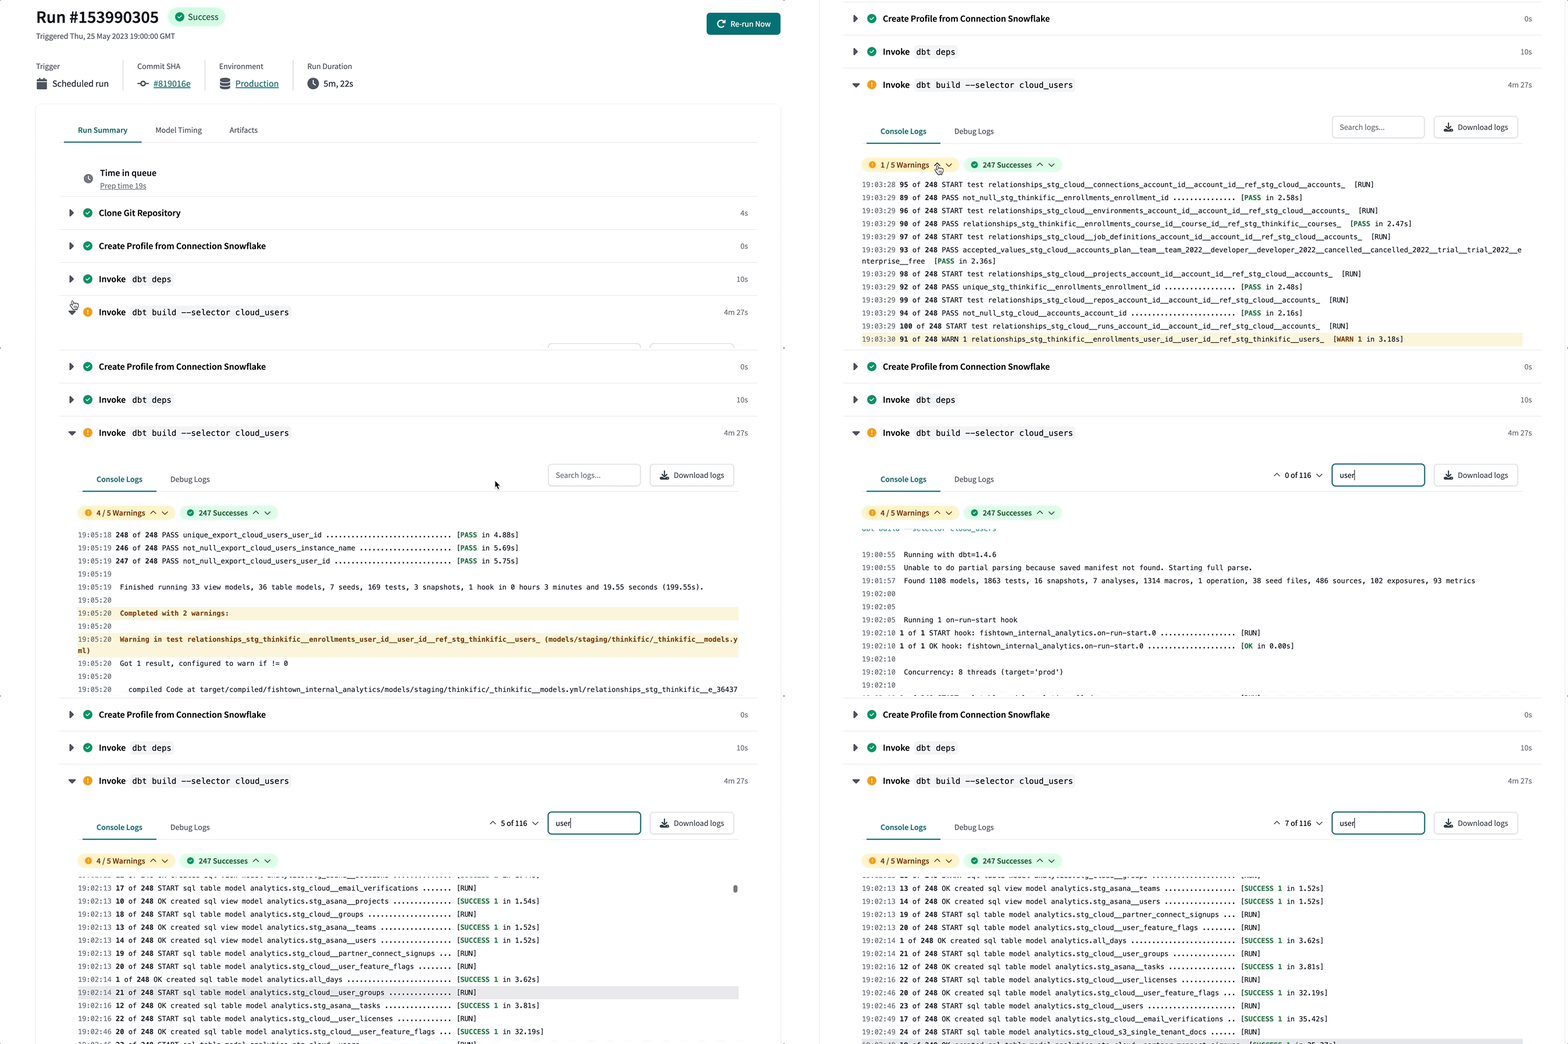
From the Run history dashboard, select a run to view complete details about it. The job run details page displays job trigger, commit SHA, time spent in the scheduler queue, all the run steps and their logs, model timing, and more.
Click Rerun now to rerun the job immediately.
An example of a completed run with a configuration for a job completion trigger:
Run summary tab
You can view or download in-progress and historical logs for your dbt runs. This makes it easier for the team to debug errors more efficiently.
Lineage tab
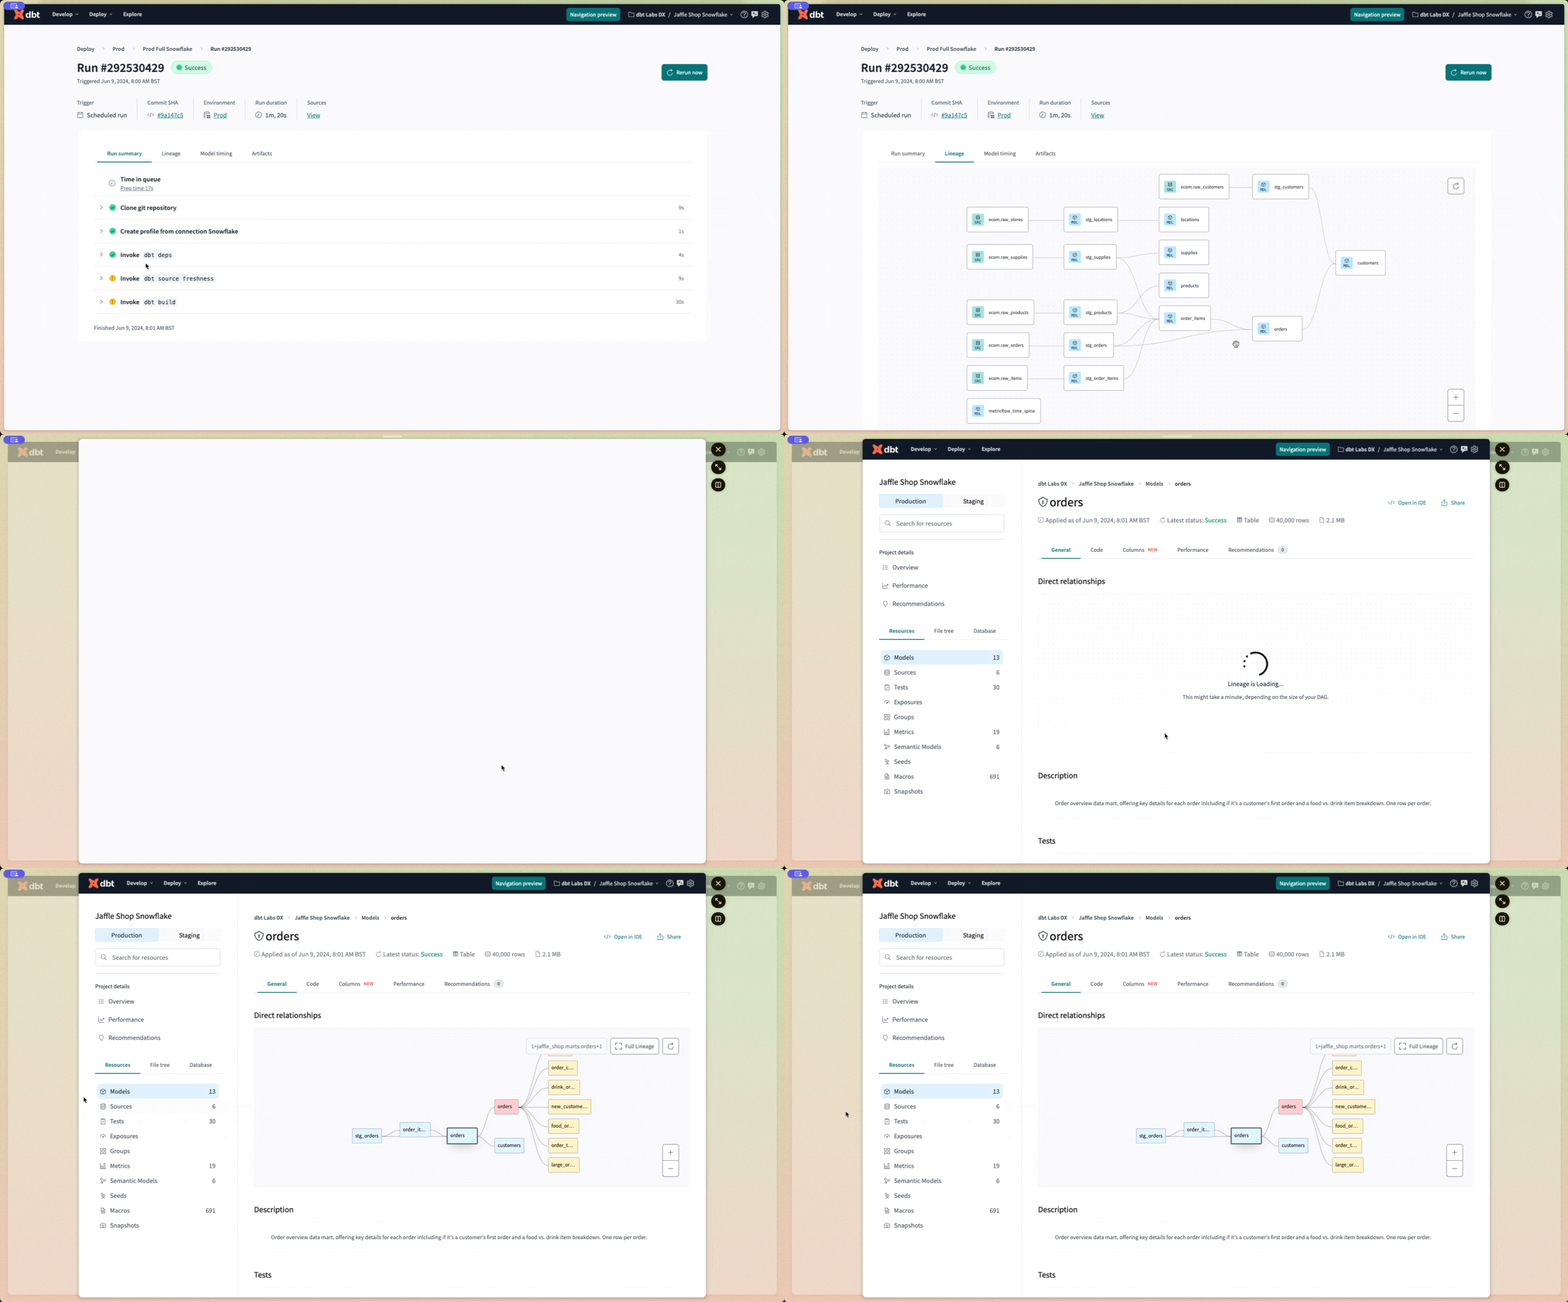
View the lineage graph associated with the job run so you can better understand the dependencies and relationships of the resources in your project. To view a node's metadata directly in dbt Explorer, select it (double-click) from the graph.
Model timing tab teamenterprise
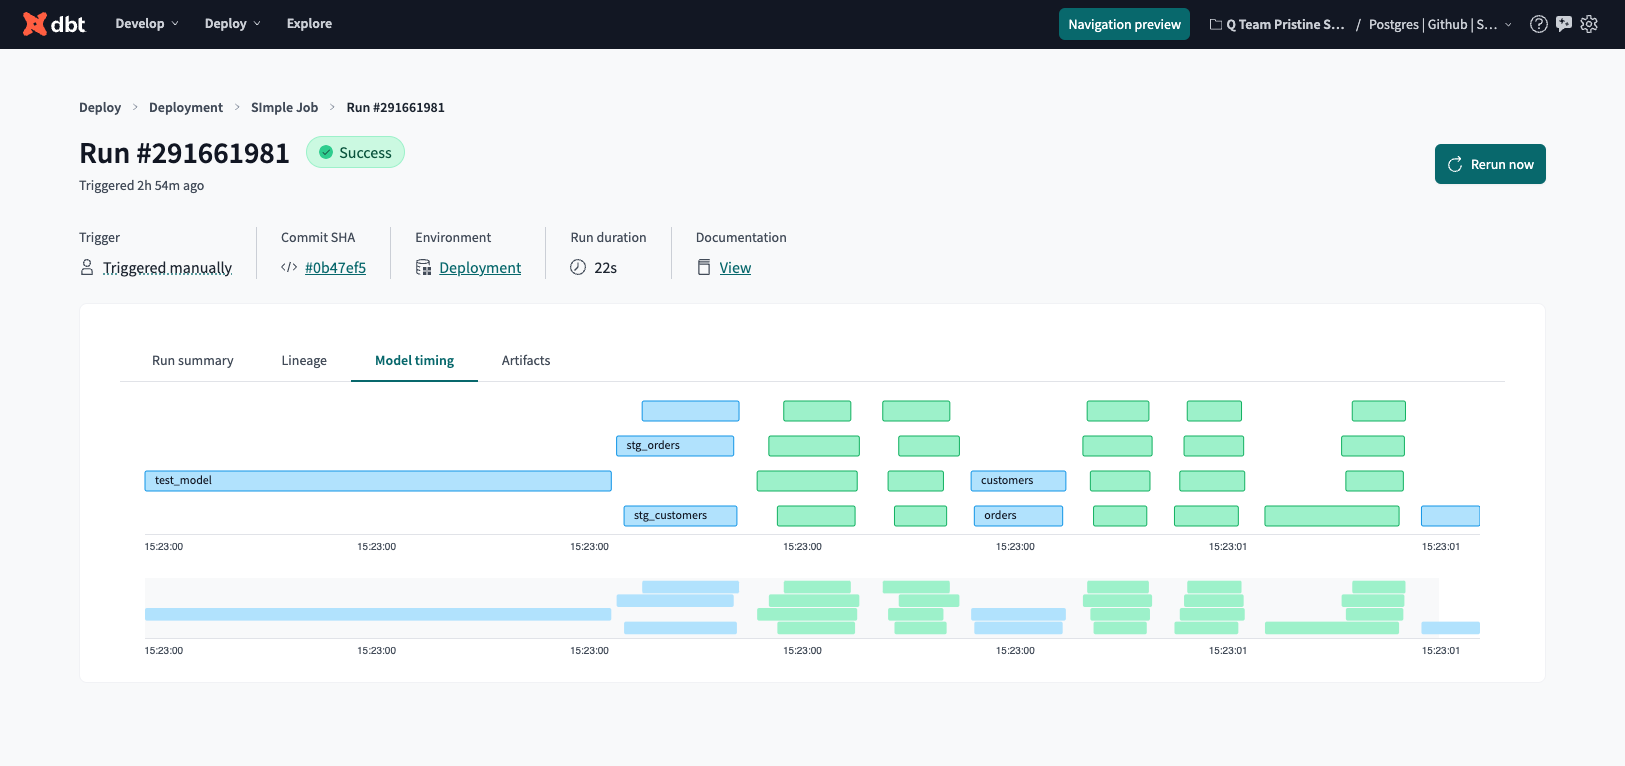
The Model timing tab displays the composition, order, and time each model takes in a job run. The visualization appears for successful jobs and highlights the top 1% of model durations. This helps you identify bottlenecks in your runs so you can investigate them and potentially make changes to improve their performance.
You can find the dashboard on the job's run details.
Artifacts tab
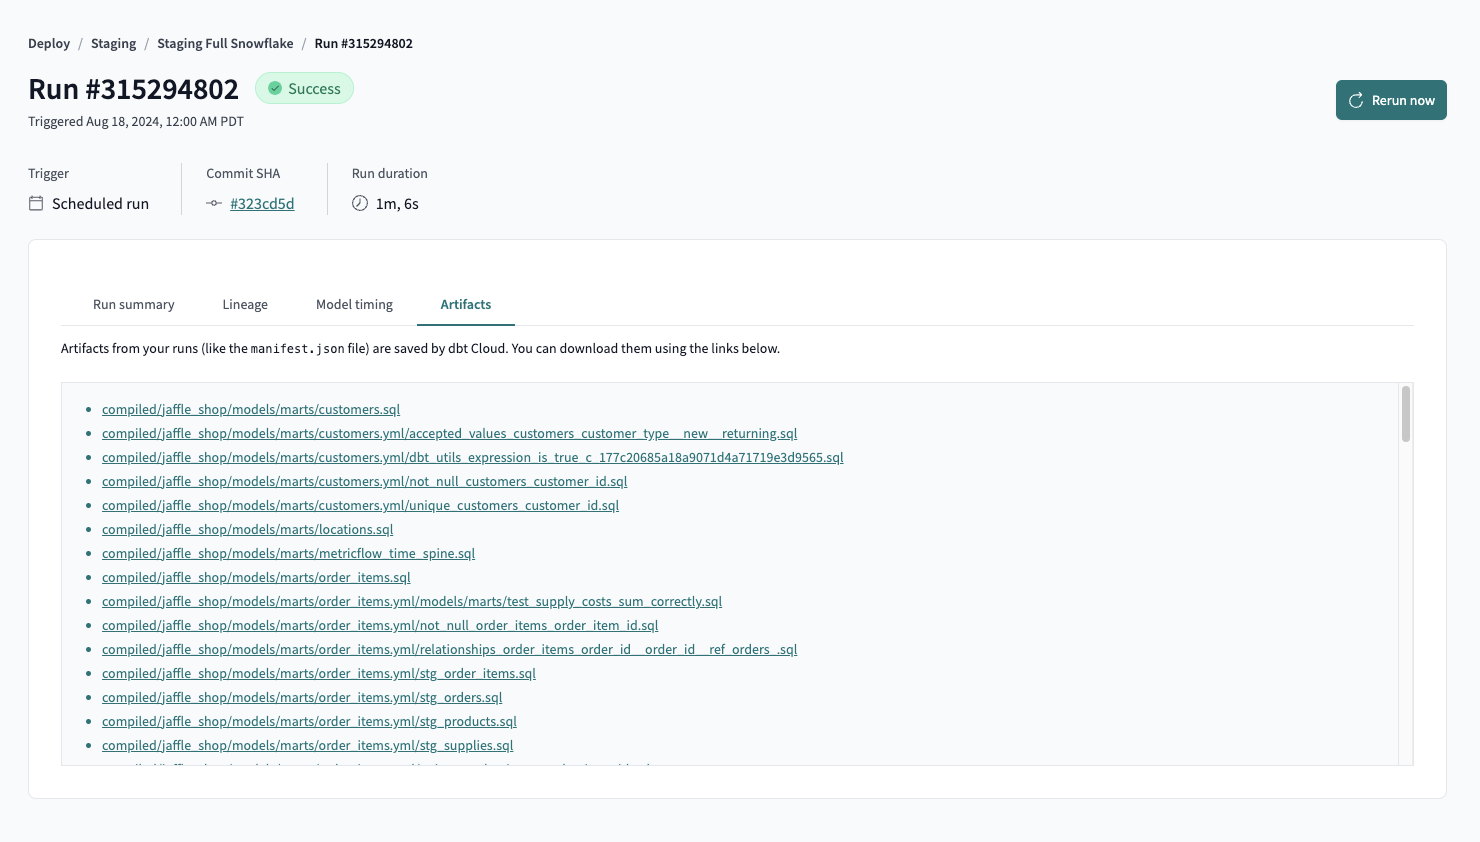
This provides a list of the artifacts generated by the job run. The files are saved and available for download.
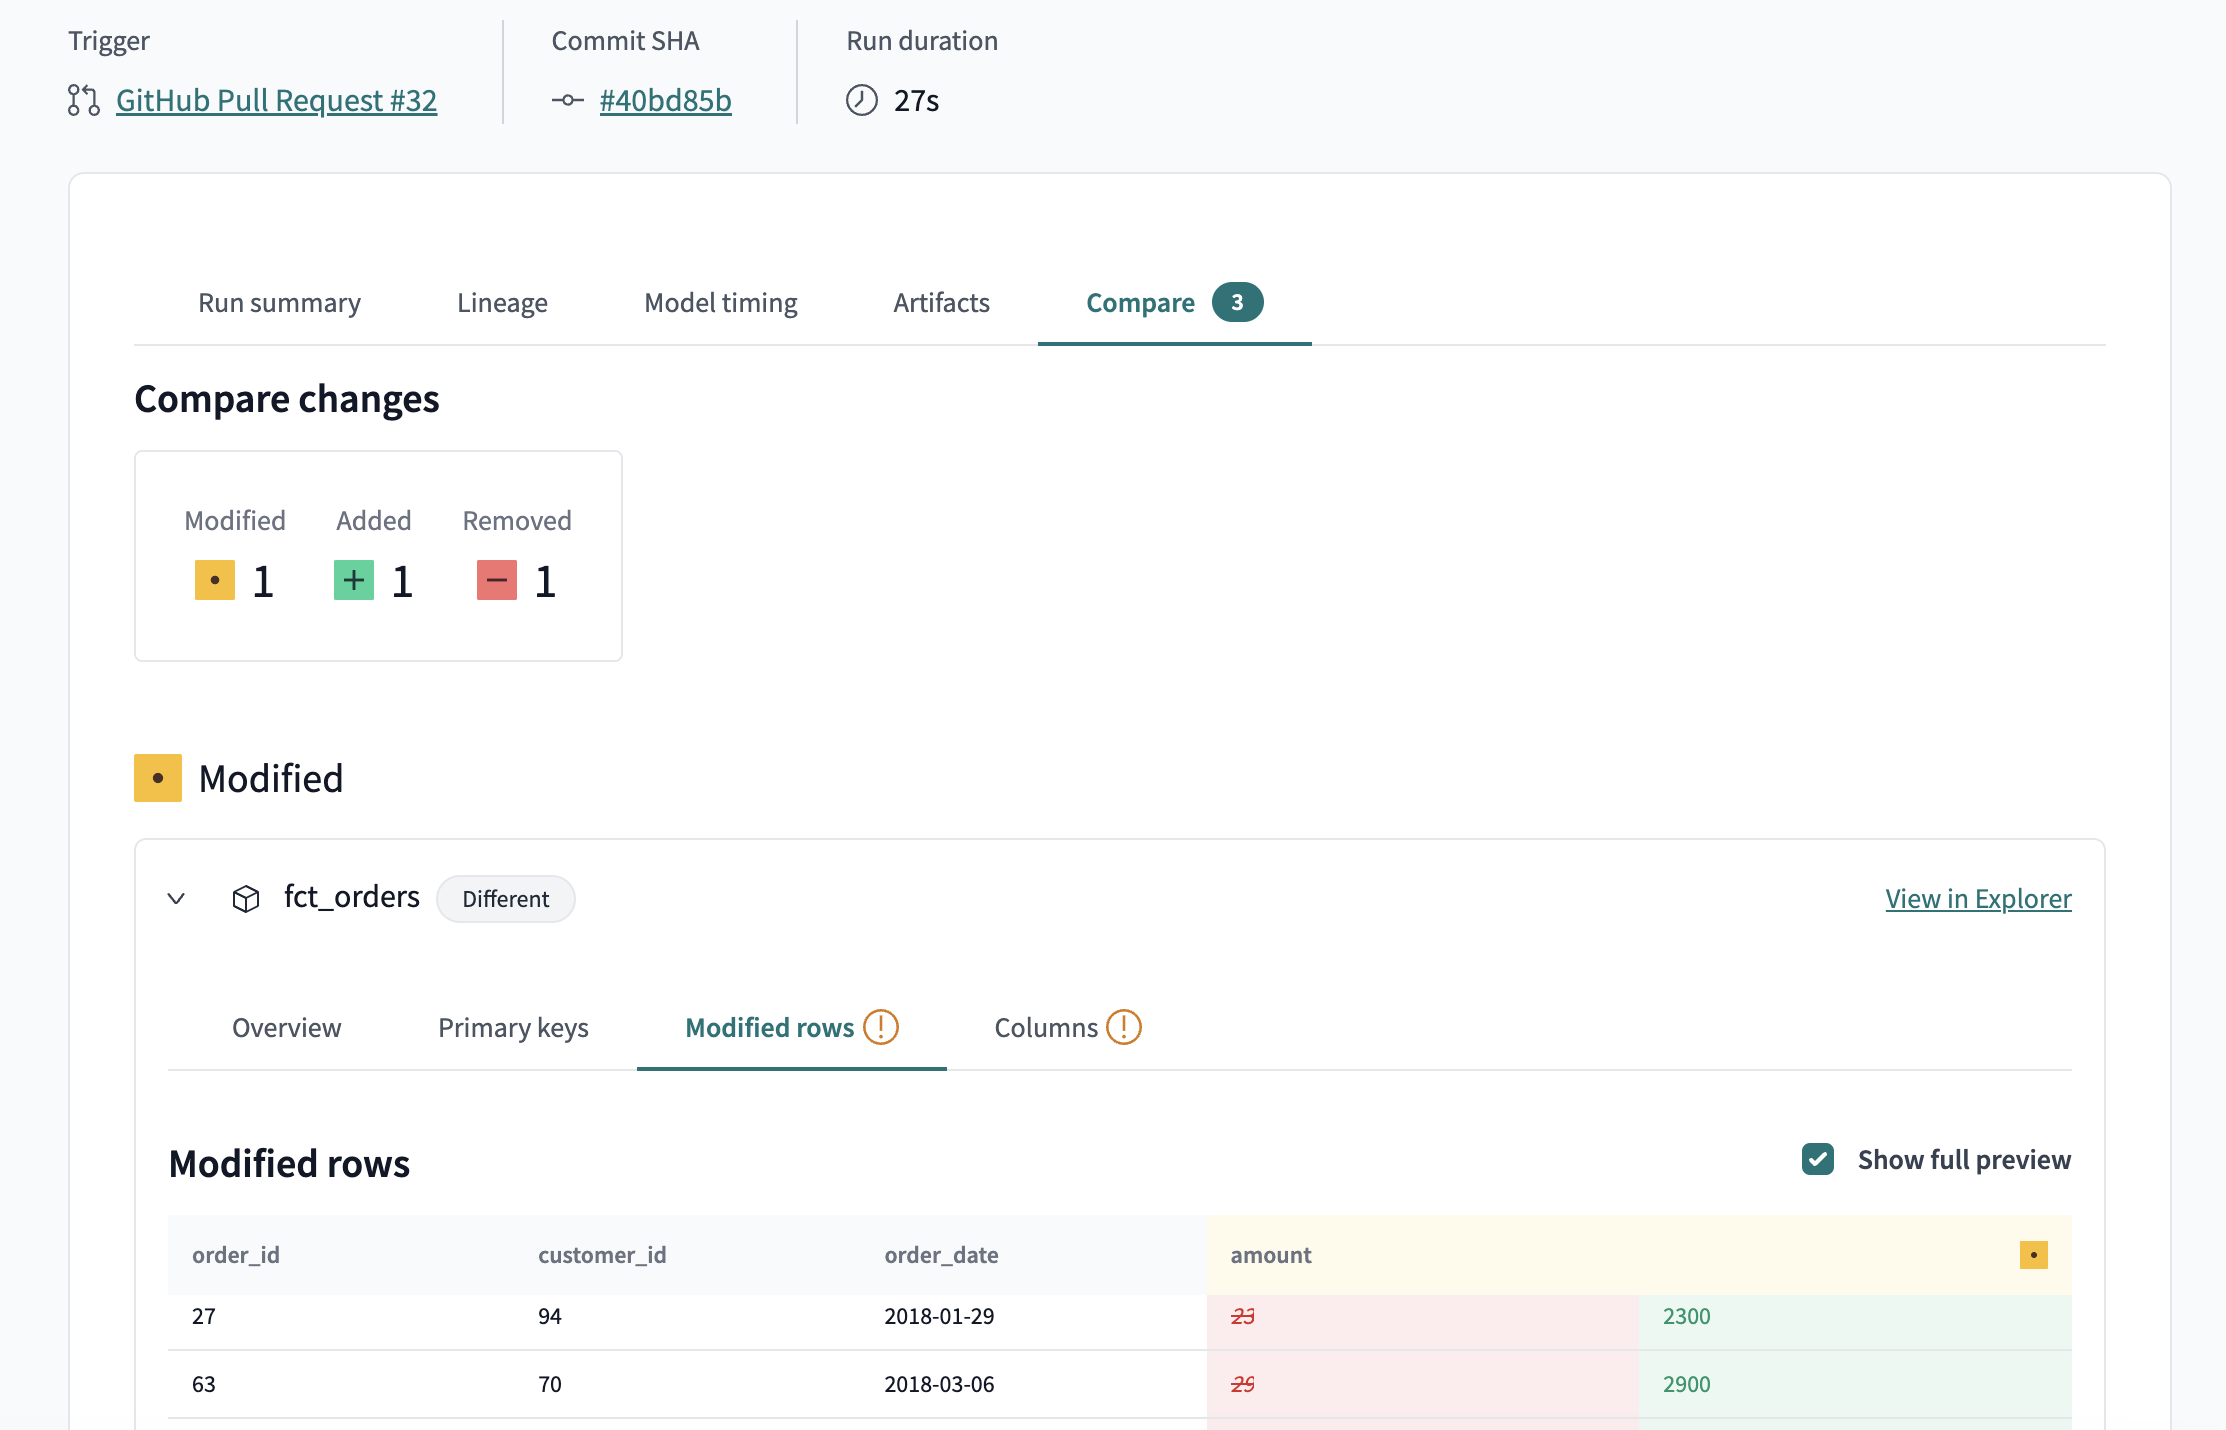
Compare tab preview
The Compare tab is shown for CI job runs with the Run compare changes setting enabled. It displays details about the changes from the comparison dbt performed between what's in your production environment and the pull request. To help you better visualize the differences, dbt Cloud highlights changes to your models in red (deletions) and green (inserts).
From the Modified section, you can view the following:
- Overview — High-level summary about the changes to the models such as the number of primary keys that were added or removed.
- Primary keys — Details about the changes to the records.
- Modified rows — Details about the modified rows. Click Show full preview to display all columns.
- Columns — Details about the changes to the columns.
To view the dependencies and relationships of the resources in your project more closely, click View in Explorer to launch dbt Explorer.

